The most important objective of a greenfield design process is to ensure that the design has a built-in safety and operability suitable for the chosen operational strategy for the lifetime of the plant. Still we also want the most cost efficient design.
Kairos vision is to enable design and pre-ops teams to follow a structured and systematic approach for operability engineering.
The operational strategies could be Autonomous, Normally unmanned, Remotely Controlled, Minimum Manned, etc.
The term operability engineering refers to the analysis and optimization of operational issues ensuring that the functions of a system are safe and reliable according to predefined operational requirements. Understanding of operational- and failure-modes is crucial for effective operational engineering.
Each process unit has a number of failure modes that will propagate in the process system resulting in more or less severe consequences. There are a few vital steps needed to be followed to be able to design according to a certain operational philosophy or strategy.
Optimizing the design of a plant involves understanding the different layers of protection including active, passive and the role of the humans operating and maintaining the plant. In other words, understanding the safeguards, barriers and counteractions is key to be able to find opportunities to improve the design or operation.
Balancing the investments (CAPEX) versus the operation and maintenance of the plant (OPEX) is the goal. Complex solutions to reduce manning and increase automation may lead to a high maintenance cost. Robust and reliable design based on simplification and utilizing the possibilities within automation and digitisation should be the objective.
Operational engineering is also an important part of the keeping a plant running. Clear understanding on how to respond to anomalies requires good supporting tool and situational awareness. Can we assure operability even with some standing failures in the plant? Will this sensor not working result in important failure modes not being detected, i.e a blind spot? Are the potential consequences of the blind spots severe?

The selected operational strategy and philosophy may contain specific goals about the operation of the plant. The high level objectives will drive how the overall design of the plant should be. Current trend is towards higher level of automation, even autonomous and often remotely operated.
Today we more often want to ensure that the design solutions have embedded technology to tell the operation teams how and when the plant requires attention for safe and efficient operations with minimized emissions.
One other important aspect is how we balance stable production versus low emissions production. Safety shall alway be top priority. However, the current understanding of the climate crisis has driven a change towards putting low emissions as a high priority, sometimes even above the objective of stable production. These strategies needs to be incorporated into the design of the plant to make sure they are met with matching solutions on how it is operated and maintained.
The highest level of visualising a plant design is the PFD (Process Flow Diagram). A PFD is a type of flowchart that illustrates the major process units or equipment and the relations (flow) between them. Most process and mechanical engineers immediately understand the objectives of each part of the process based on the PFD, but still the objectives are not documented explicitly. As a particular plant design is refined, more details will be added and a P&ID (Piping and Instrumentation Diagram) will be developed to show even more details. Example of information that is added is typically instruments, actuators, bypass lines and safety devices.
The PFD below is a an example of a Distillation Tower.
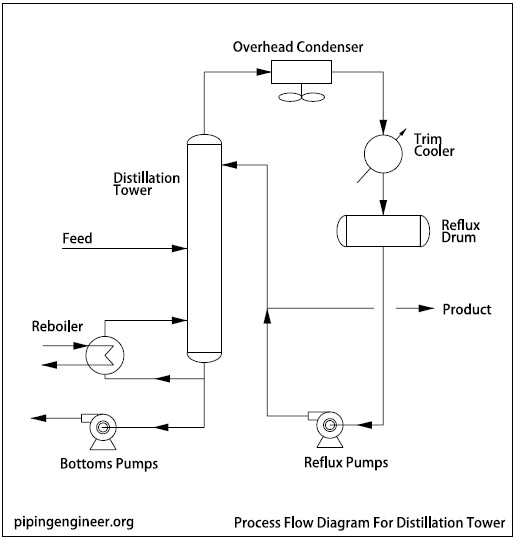
Image Source: pipingengineer.org
It is fairly easy to understand the objectives of the total process from feed to product in the example below, but understanding the objectives of each equipment requires some skills, experience and thinking. As the design develop and matures, the understanding of why the different equipment has been selected may be forgotten or indeed maybe never explained to newcomers to the project or plant.
Kairos approach starts with understanding the overall objectives of a plant and how to break it down into the objectives of each component. Let´s take one simple example: A pump may have the objective of filling a vessel, it might also be maintaining a mass flow or pressure. To be able to build relations between failures and consequences is vital to know the objectives. The result of this approach is something we call an objective tree. Building the objective trees is vital to be able to express a failure on the way to reach to reach a goal. All this is documented in the resulting functional model.
Once the objectives of the process has been established, the failure modes needs to be documented. In most cases the design work process will contain a sort of Failure Mode, Effect and Criticality Analysis (FMEA and FMECA) activity. The Kairos standard model library components will already contain an initial list of failures, while additional short workshop sessions with SMEs (Subject Matter Experts) may reveal the need to add more. Once completed, the functional library modules developed for the actual plant will contain:
When failure modes are introduced it is important to ensure that a standardised functional breakdown is follower. It is important to align the breakdown to ensure that effects of failures can be propagated correctly in the system.
To ensure an effective modelling effort, Kairos standard model library elements are used. This is vital to ensure that past design- and operational-experience is captured and reused in new or modified design. This way we can ensure that design knowledge is passed on and reused from project to project. In addition operational teams builds up experience when operating a plant. The library model elements includes operators experience also. Hence our model library elements come configured with the following knowledge:
In this way we can ensure that design expertise and operational experience is combined and ready for re-use across projects and operational assets. This is true knowledge sharing.
The standard ISO 14224:2016: Petroleum, petrochemical and natural gas industries — Collection and exchange of reliability and maintenance data for equipment, provides a comprehensive basis for the functional breakdown.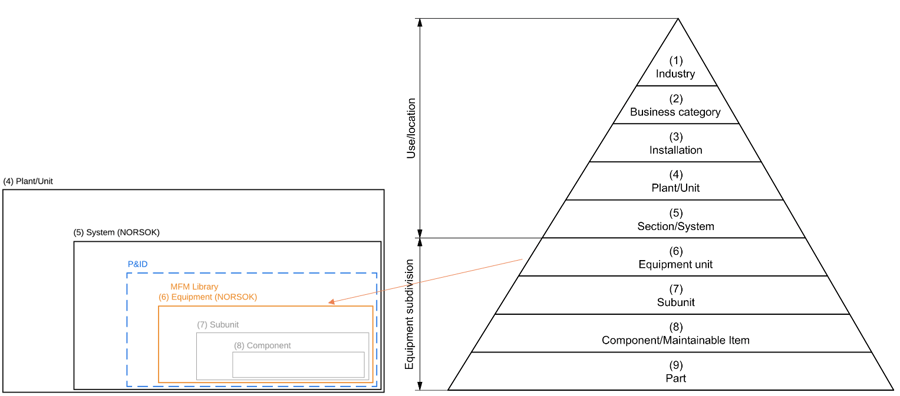
Functional breakdown of model library
This figure shows our current breakdown when modelling and how our functional model libraries fits into the ISO standard. This is vital when showing how faults may propagate from equipment to equipment and further into systems and plants. Functional models will also be grouped according to P&ID to facilitate easy navigation when in P&ID view.
Based on the objective trees, model library elements and P&IDs, the overall functional model of the plant is established. This is a relatively easy work process and is typically done in 6-12 weeks for a medium size processing plant.
Once the model is in place, we start to run our unique Casual Mode Reasoning producing the causal mode graph. In short this graph shows all failure modes that have been included and the propagation path through sensors, actuators, psv (passive safety valves) to consequence. As this graph shows all failure modes and all consequences we have developed reports and different ways of visualising this many to many graphs, to simplify the complexity for human use. The different user interfaces we have made are designed to help optimize different parts of the design and operation. To simplify the understanding of the graphs we have created a common graphical language. First all graph start with root cause (on the left hand side) and passes through the different sensors, actuators etc. and ends up with consequences on the right hand side. Symbols and color coding are also important.
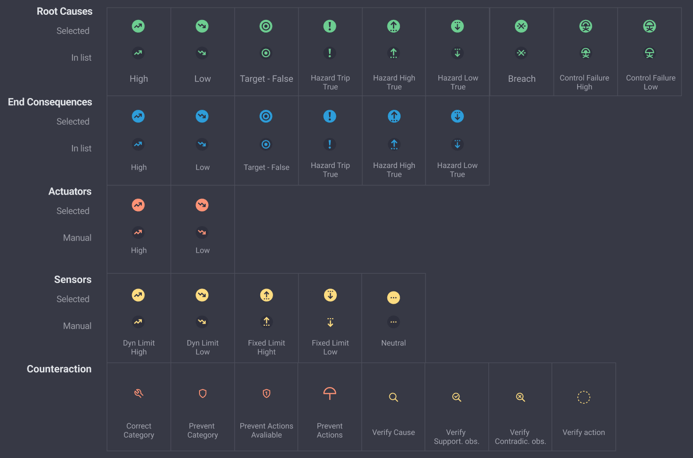
This figure shows the legend for all of the following graphs
The P&ID view is based on displaying the graph on top of the provided design drawing with tools for filtering on root cause and consequence. The P&ID (or PFD in early design stages) has been selected as the main process design drawing which both projects and operations can easily relate to. The tool will provide instant recognition and display complex relations. Typically used during design reviews and HAZOPs (HAZard and OPerability).
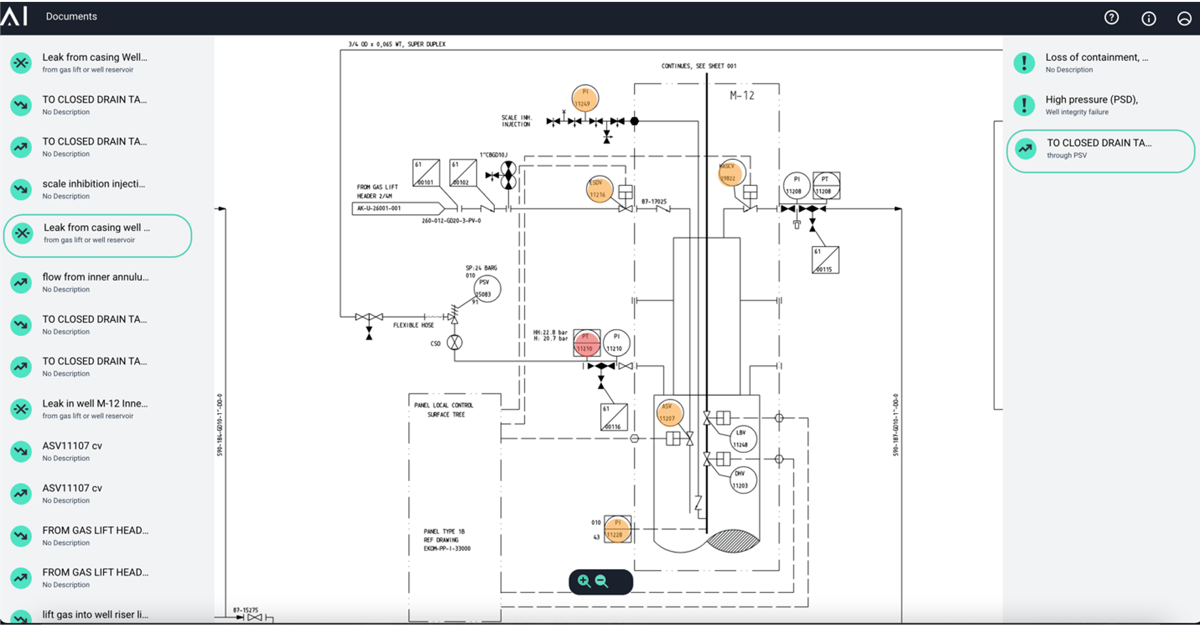
P&ID view
Selecting a root cause (left column) will filter down the consequences (right column) to the ones related to the selected cause. When selecting one of the resulting consequences, the view will highlight the sensors, actuators and other safeguards such as PSV (Pressure Safety Valve) or rupture discs affected.
The tree view has been created to visually illustrate how scenarios develop. Starting with the root cause (failure mode) on the left hand side and illustrating how the fault propagates towards the right through sensors, actuators and other field equipment until a consequence occurs. Manual verification steps may also be added if the sensor precision or coverage is not sufficient to uniquely identify the root cause. The graph may be used in different modes:
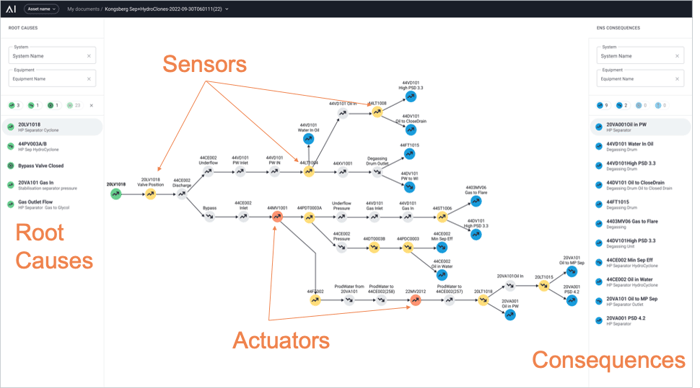
Tree view
The sensor coverage view shows how well the sensors are able to uniquely detect a root cause. The sensors are listed in a tabular view showing if and how they will react to each root cause or consequence. Typical use cases:
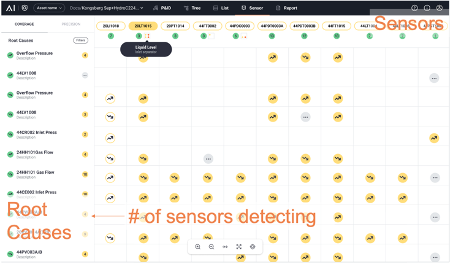
Sensor coverage
The sensor precision graph is used to indicate how unique the detection of the potential failure modes for the plant is. I.e. how well will this combination of sensors be able to distinguish one or more root causes. This information is vital to understand if unique detection is possible for current level of instrumentation. If the pattern of sensors points to the same root cause, no operator, no algorithm and no machine learning will be of use without adding information. The missing information may be collected manually from the plant maybe by a field operator or using drones or robots for remotely operated plants.
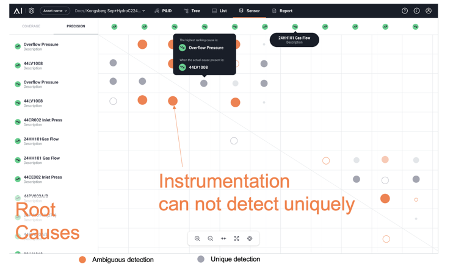
Sensor Precision
The orange points indicates root causes without unique detection. I.e the results when trying to find the reason behind a deviation will be ambiguous. Sensors should be added or moved if we are in a design phase. During operation, field operator observations should be used in addition.
If we think about the huge multi dimensional graph connecting all root causes through instrumentation to consequences, the above views has been developed to make it more easy to read and use during design and operation.
In some cases it is useful to export the graph into a line by line table. The table can be filtered and be used to find specific relations during design, operation and for alarm management
Examples of filtering during design (or HAZOP) may be:
During operation:
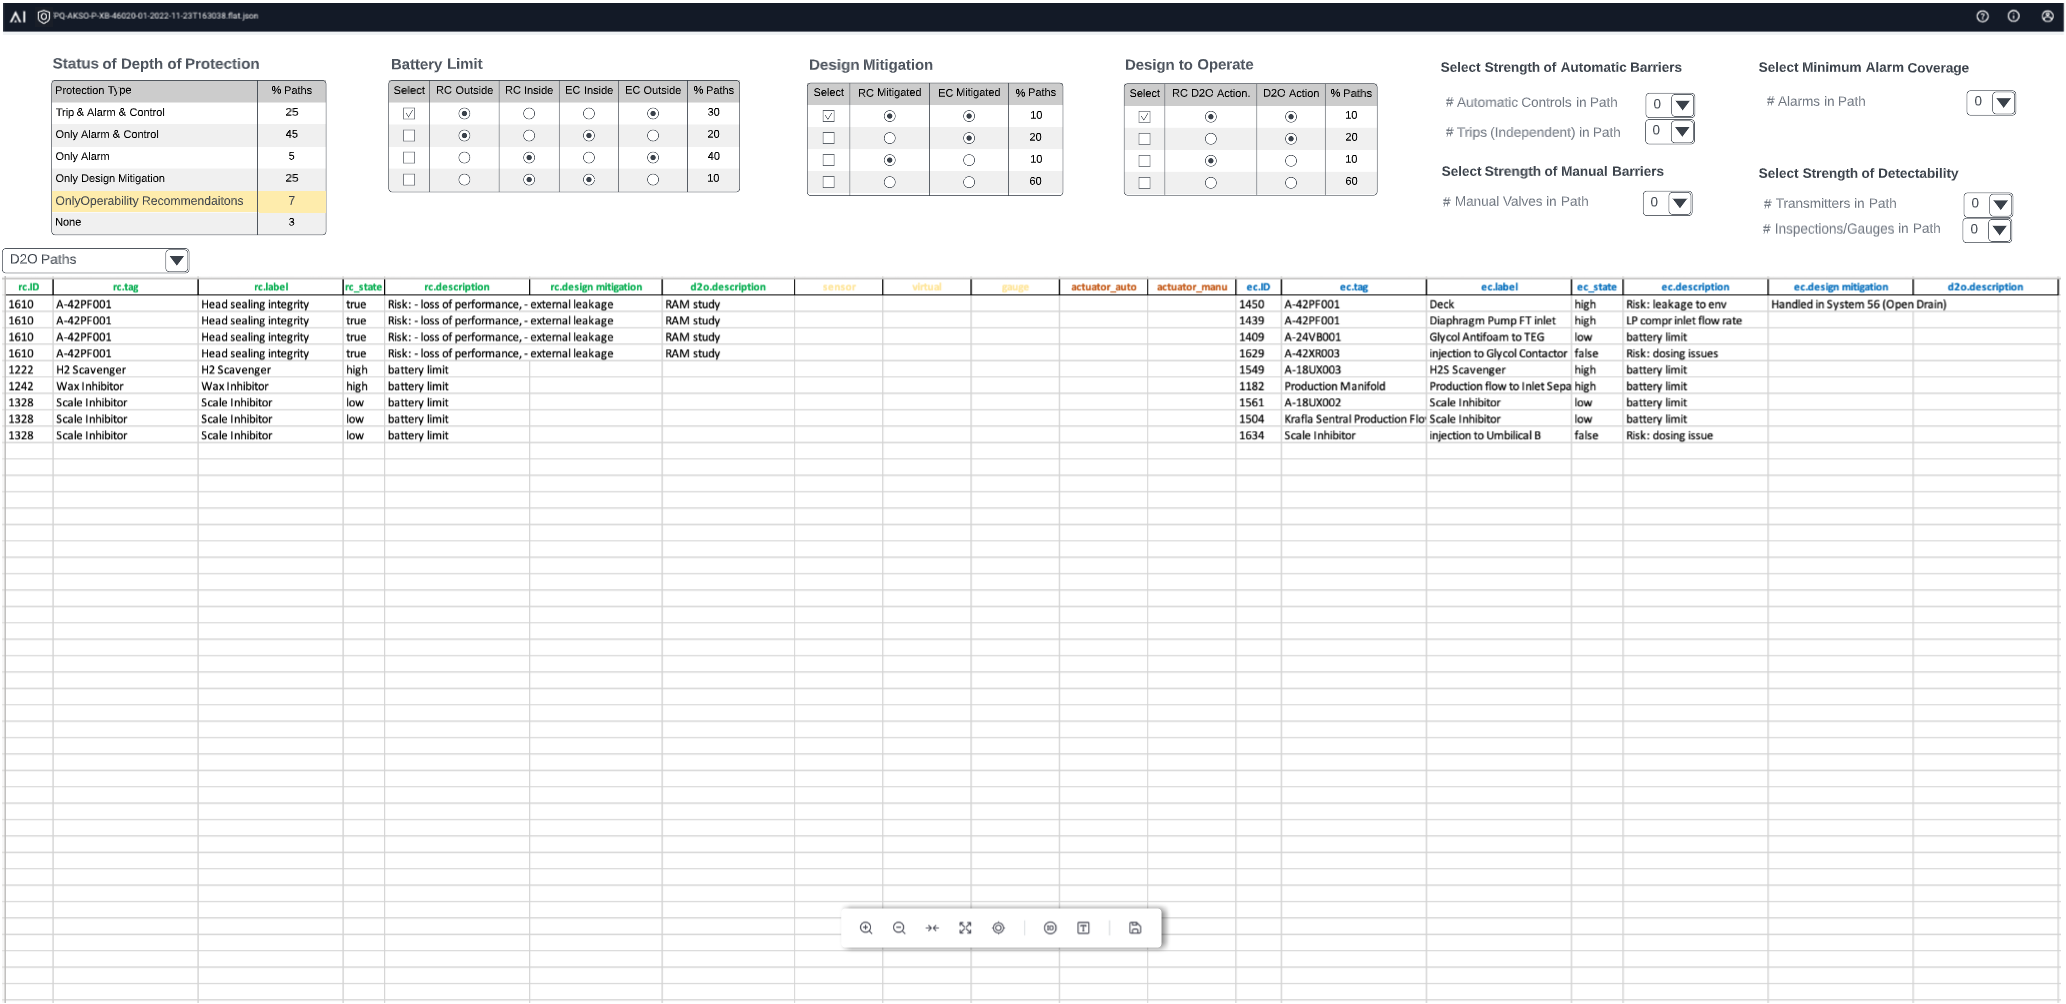
Report view
The data can also be exported to Microsoft Excel for further analysis.
We're also open to develop new views towards your specific needs.
Learn everything you need to know about our product!

Kairos Technology is a software company that develops innovative and disruptive technology within the energy industry.
Phone: +47 952 91 478
E-mail: info(a)kairostech.no
Address Norway:
Kanalsletta 4, N-4033 Stavanger
Address Denmark:
DTU Science Park, Diplomvej 381, DK-2800 Lyngby

Copyright © 2020 Kairos Technology AS. All rights reserved.