The high level theme for the release is how we ensure coverage of failure modes. Kairos functional modelling is now based on a process library of safety and operability units. The building blocks are based on design guidelines with Failure Mode and Effects Analysis (FMEA) and Experience (ISO14224). This has radically improved the models where the total number of failure modes has been increased by a factor 10. A topside model will now typically cover 3500 failure modes. In short: higher quality models implemented faster with little to no user involvement.

HAZOP Assistant
Another important improvement is making the HAZOP assistant available in a separate user interface, called Asset Portal. Our clients will get access to their asset and will be given login credentials with easy and intuitive access to their tools and models.
The following HAZOP assistant tools will be available from the new cloud-based Asset Portal:
- P&ID View – superimpose causal graphs on P&IDs
- Tree view – causal graphs in fault trees or fault scenarios - like trees.
- Sensors – Mapping of sensor coverage and precision
- HAZOP Analyzer – analyze the causal relations to ensure HAZards and Operability is covered.
The same functional model is used and is fully compatible, for both the HAZOP Assistant and for the Control Room Assistant. Therefore, it will be easy to leverage the knowledge from both design and operation as part of the usual Management of Change process. 
P&ID View
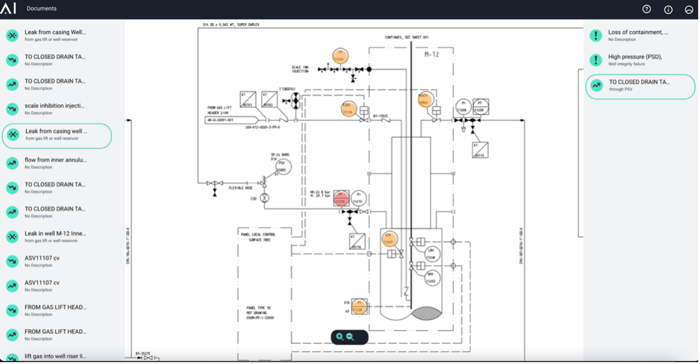
Figure 2: P&ID View
The P&ID view show the causal graphs superimposed on P&IDs. From this view a user can easily see what instruments on the P&ID will react to each failure mode and its consequences.
Tree View
The tree view has been created to visually illustrate how scenarios can develop in the current plant design. The view is prepared to normally read the tree by starting with the root cause (failure mode) on the left-hand side. Following the illustration on tree expansion and how the fault propagates towards the right side, through sensors, actuators, and other field equipment until related consequence occurs.
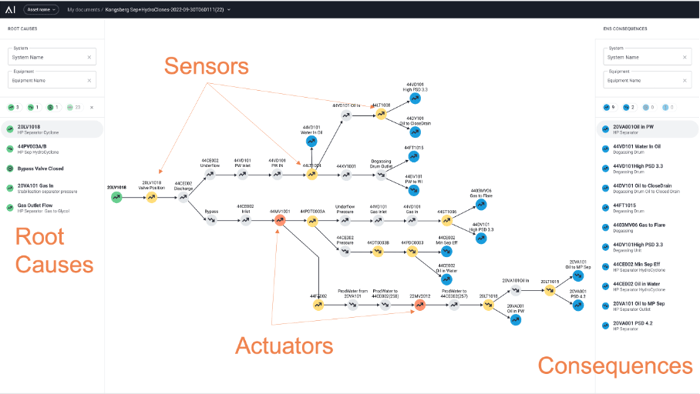
Figure 3: Tree view available for operability engineering
Example: Manual verification steps may be added if the sensor precision or coverage is not sufficient to uniquely identify the root cause. The graph may be used in different modes:
- Failure mode selected - Show how a failure propagates to the corresponding consequences. Engineered for assessing risk of a failure. Also useful when planning maintenance work to understand how critical the work order is.
- Consequence selected - Show which initiating event or failure modes can result in the selected consequence. Useful to add human mitigations and update operational procedures.
Control Room Assistant
The control room assistant user interface has also been updated and aligned with the other products to provide a consistent look and feel across all applications (i.e., symbols, color scheme, etc.) shown by this table:
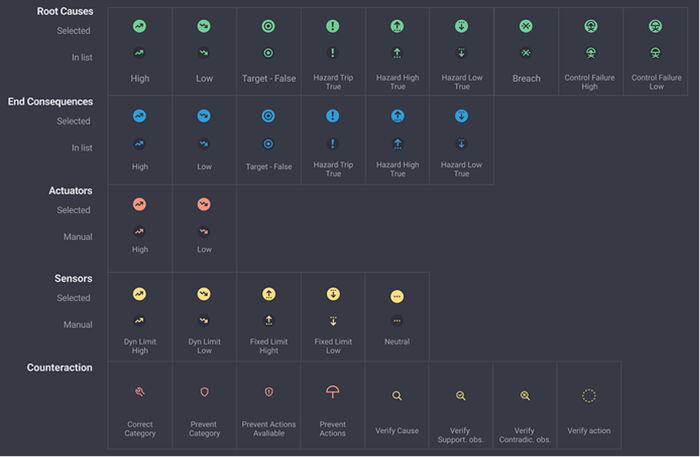
Figure 4: Symbols and color scheme of Kairos products
Additionally, counteractions has now been fully implemented. We recommend following the work process on how to best deal with failures in the process using the information and guidance from the Control Room Assistant.
Counteractions - Verify
The counteraction step may include a need for a verify action if unique root-cause detection is not possible due to lacking instrumentation from plant. Verify actions are typically initiated by control room operators to ask for manual verification of a situation/status, and/or equipment- or instrument-state by field operators.
Counteractions - Correct
The correct step will contain advice and procedures on how to permanently fix the issue. This may be basis for a maintenance work-order if it is a complex procedure.
Counteractions – Prevent
The software may automatically generate suggested preventing steps, if the model has identified any actuators available on the path, which is connecting cause and consequence in the evaluation.
Consequences
Consequences have been subject to further improvement in our products. They will now be classified into Environment, Production, or Safety mode definition. Additionally, we are currently implementing a feature where only consequences of operational significance are kept. This new feature allows the control room operator to focus on the outcomes that are most important from an operational perspective. This improves the situational awareness by eliminating consequences that won't significantly affect operations.
Emissions Radar
The Emissions Radar is a separate additional user interface built on the same model and data flow as the CRA. To take advantage of the Emissions Radar, a full CRA installation is required first. In the Emissions Radar UI, the operational objectives are safety, then production and emissions, when the plant is in stable safe operation. Kairos' new Emissions Radar intends to support an operating culture focused on emissions reduction with clear, easy to understand, guidance on how to best operate for lower emissions and reduced greenhouse gas emissions.
The radar screen indicates the key process areas of concern (example: oil, gas, water, utilities) utilizing movement to catch the attention of the human eye, and showing the contributing factors that are resulting in higher than expected emissions or a safety/production issue. When these contributing factors that are causing issues approach the center of the Radar, it indicates that they are the most concerning areas. Once these variables move towards the center of the radar, the Control Room Assistant will instruct the user on the best process actions to take, to move those issues back to "safety" (better/lower emissions for example). Should there be a safety issue at any point in time, then these take priority and we go back into "CRA-mode" where safe production takes precedence.
.png?width=700&height=394&name=MicrosoftTeams-image%20(8).png)
Figure 5: Stable safe production, potential GHG reductions indicated in the center
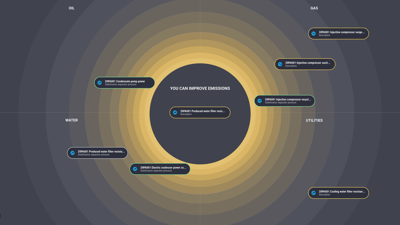 The Emissions Radar is intended to be displayed on a large screen for an instant operational mode overview with clear suggestions on operational improvements. The radar screen also changes colour based on the operational level of concern (or threat). Green, yellow, or red based on standard operating procedures, emissions, or safety concerns. The initiating events are dynamically closer towards the centre of the screen updated in real-time as new sensor values confirm them. The placement indicates risk, combining probability and impact of end consequence. The circle in the centre is used to indicate passing an acceptance threshold.